BASIC/01 OF 15
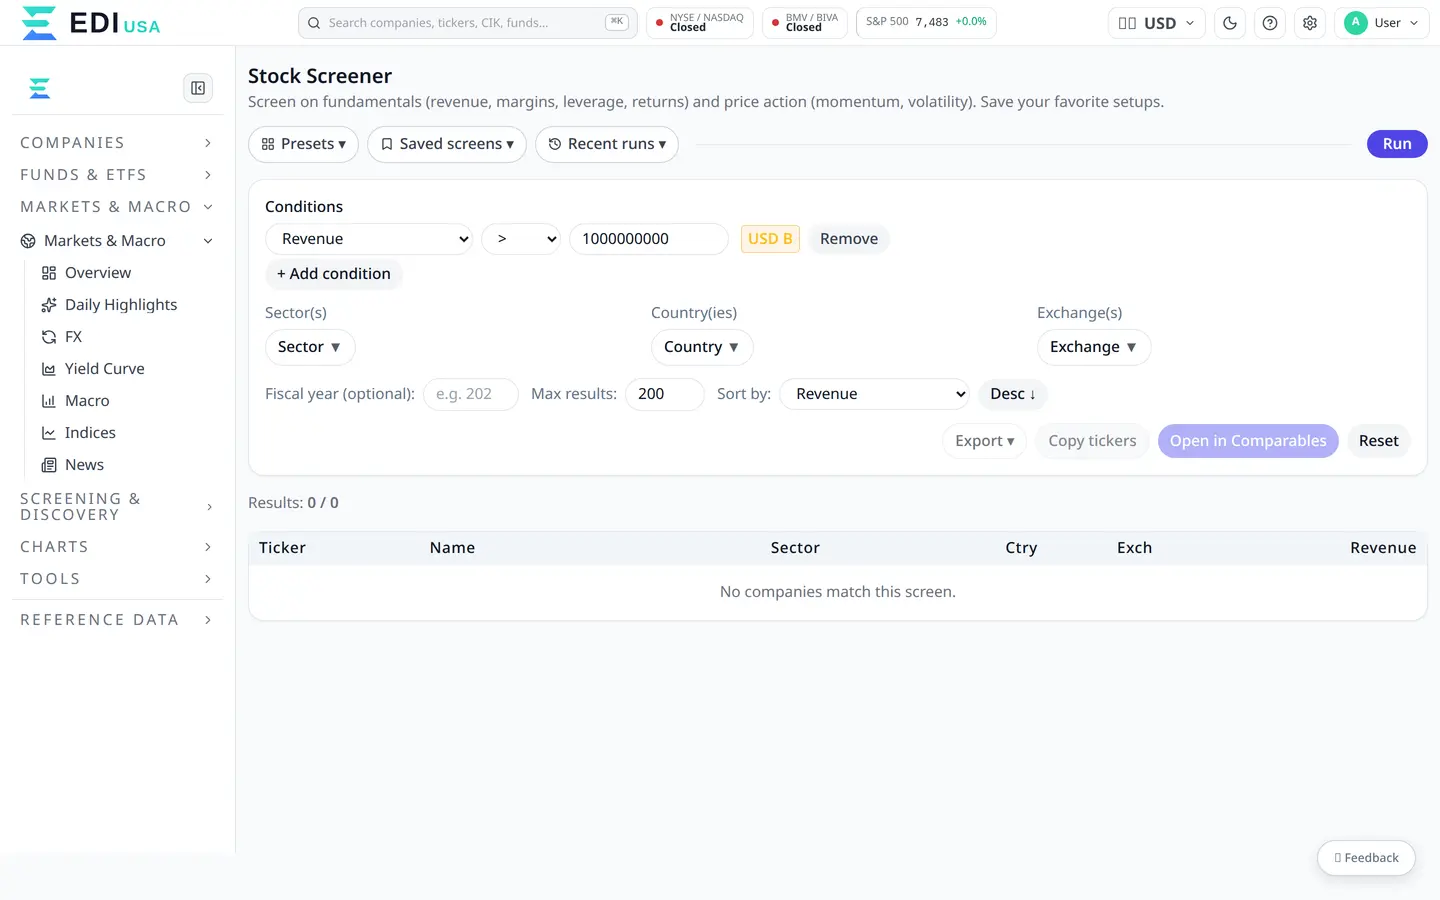
Screening
Set conditions across fundamental, technical, and market indicators and let the screener sweep the entire universe of assets. In seconds, only the names that meet every criterion remain.
Filters that stackTemplates of your ownSend to ExcelSeveral bases
BASIC/02 OF 15
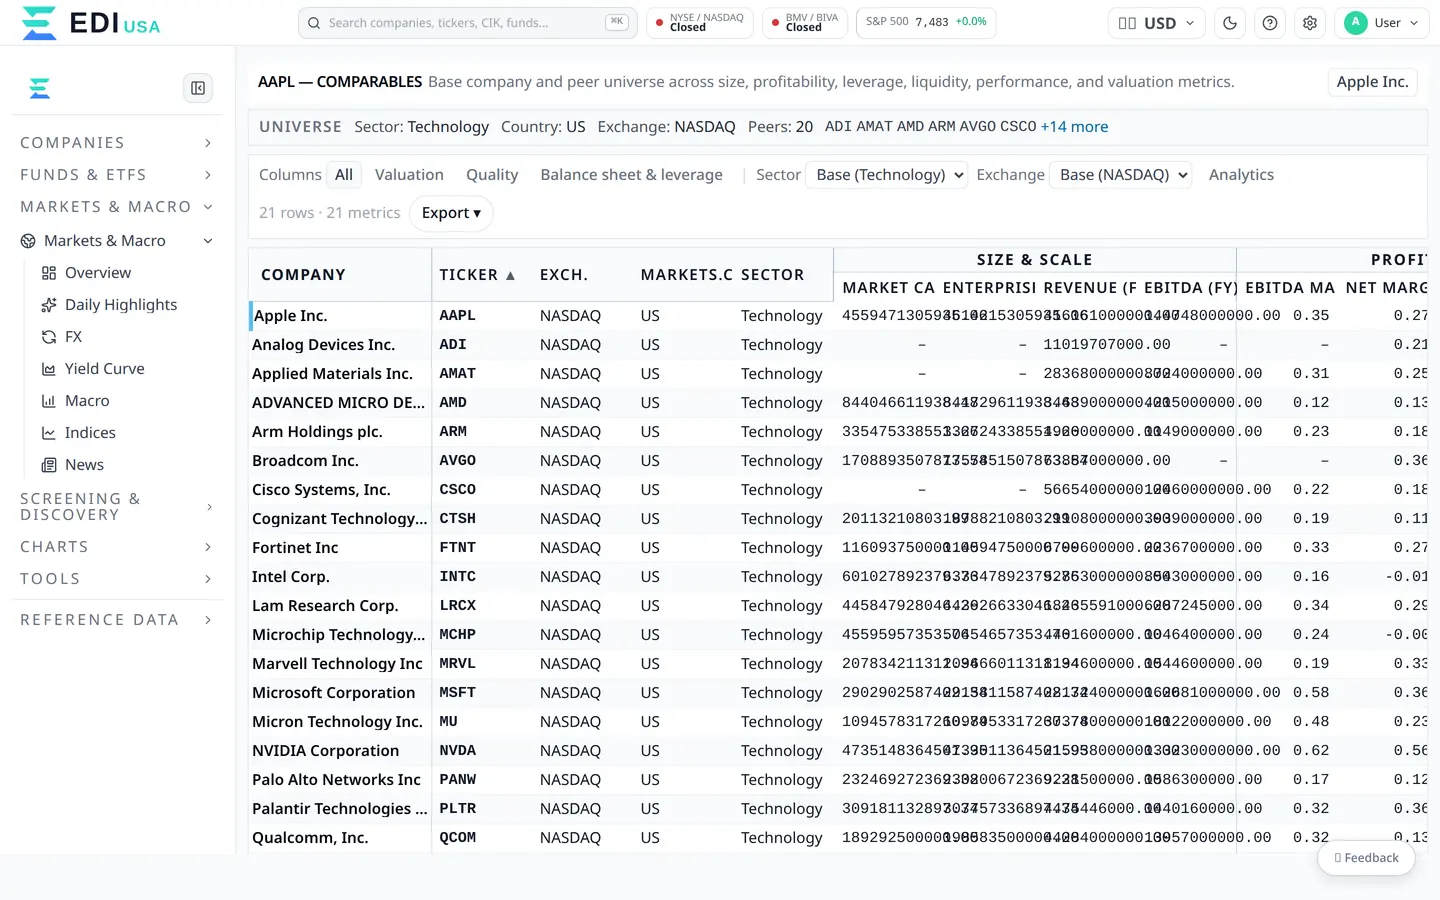
Matrixx
Build a comparison table from the indicators you pick in the EDI Finance base and line companies, funds, or portfolios up against one another. Historical series align on their own and descriptive statistics are computed for you.
N×M crosstabSeries over timeRankingHeatmaps
BASIC/03 OF 15
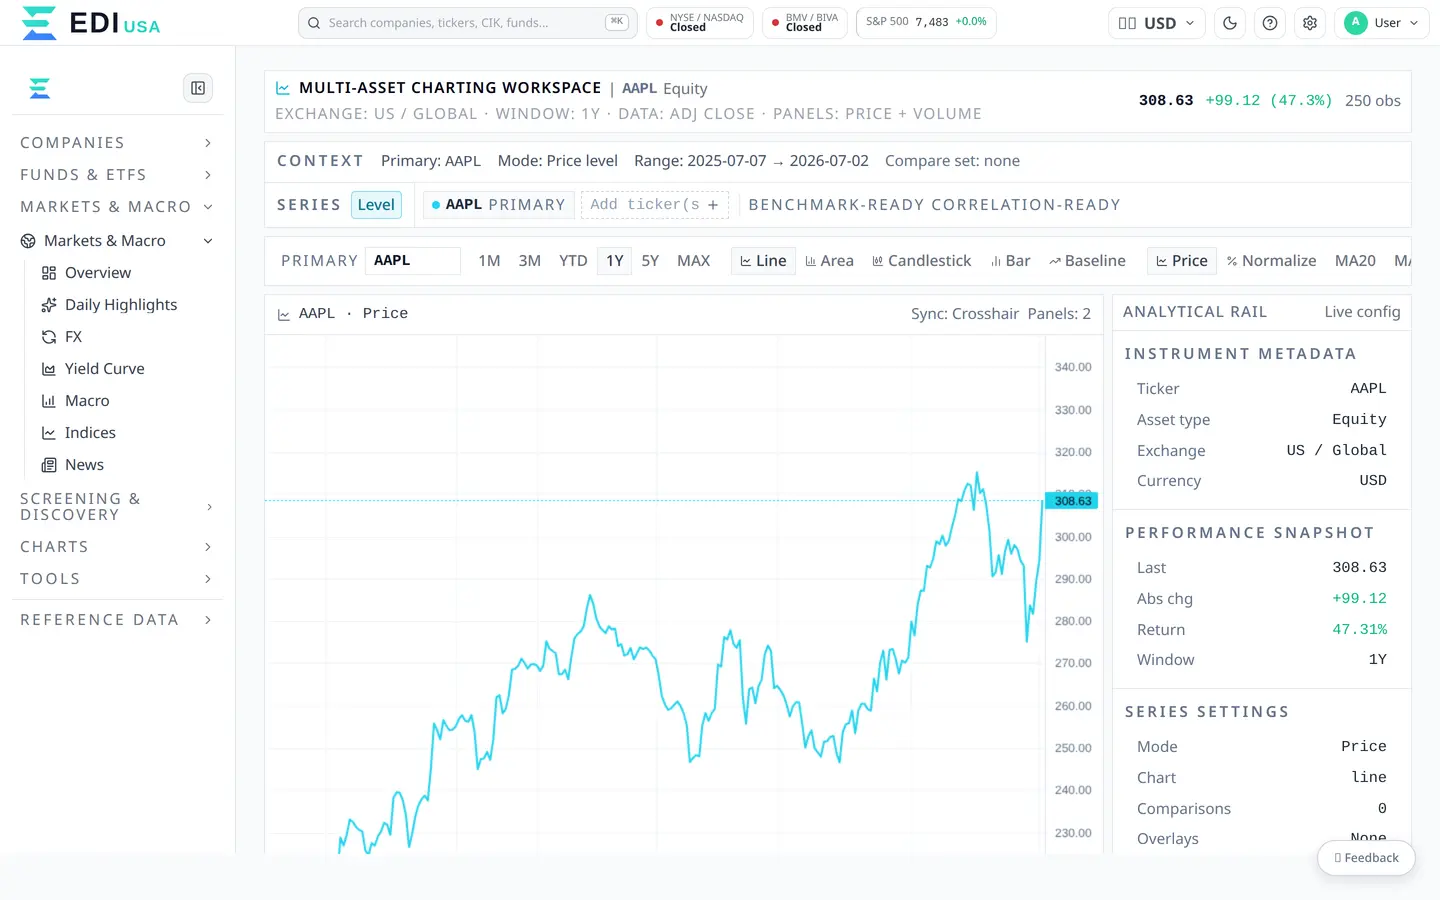
Charts
Plot, overlay series, switch timeframes, and layer technical indicators onto every view, with fundamental and technical analysis living inside a single workflow.
Several timeframesTechnical studiesOverlaid seriesExport
ADVANCED/04 OF 15
Valuation DCF
A Discounted Cash Flow model that comes preloaded with EDI Finance data. Project revenue, EBITDA, WACC, and target price while sensitivity analysis and scenarios run on their own.
DCF ready to runSensitivityWACC recalculated
ADVANCED/05 OF 15
Portfolio Optimization
Portfolio optimization grounded in Markowitz: map the efficient frontier, settle on the optimal risk-return allocation, set your own constraints, and simulate rebalancing across the entire history.
MarkowitzEfficient frontierConstraintsBacktest
ADVANCED/06 OF 15
Pair Trading (Long/Short)
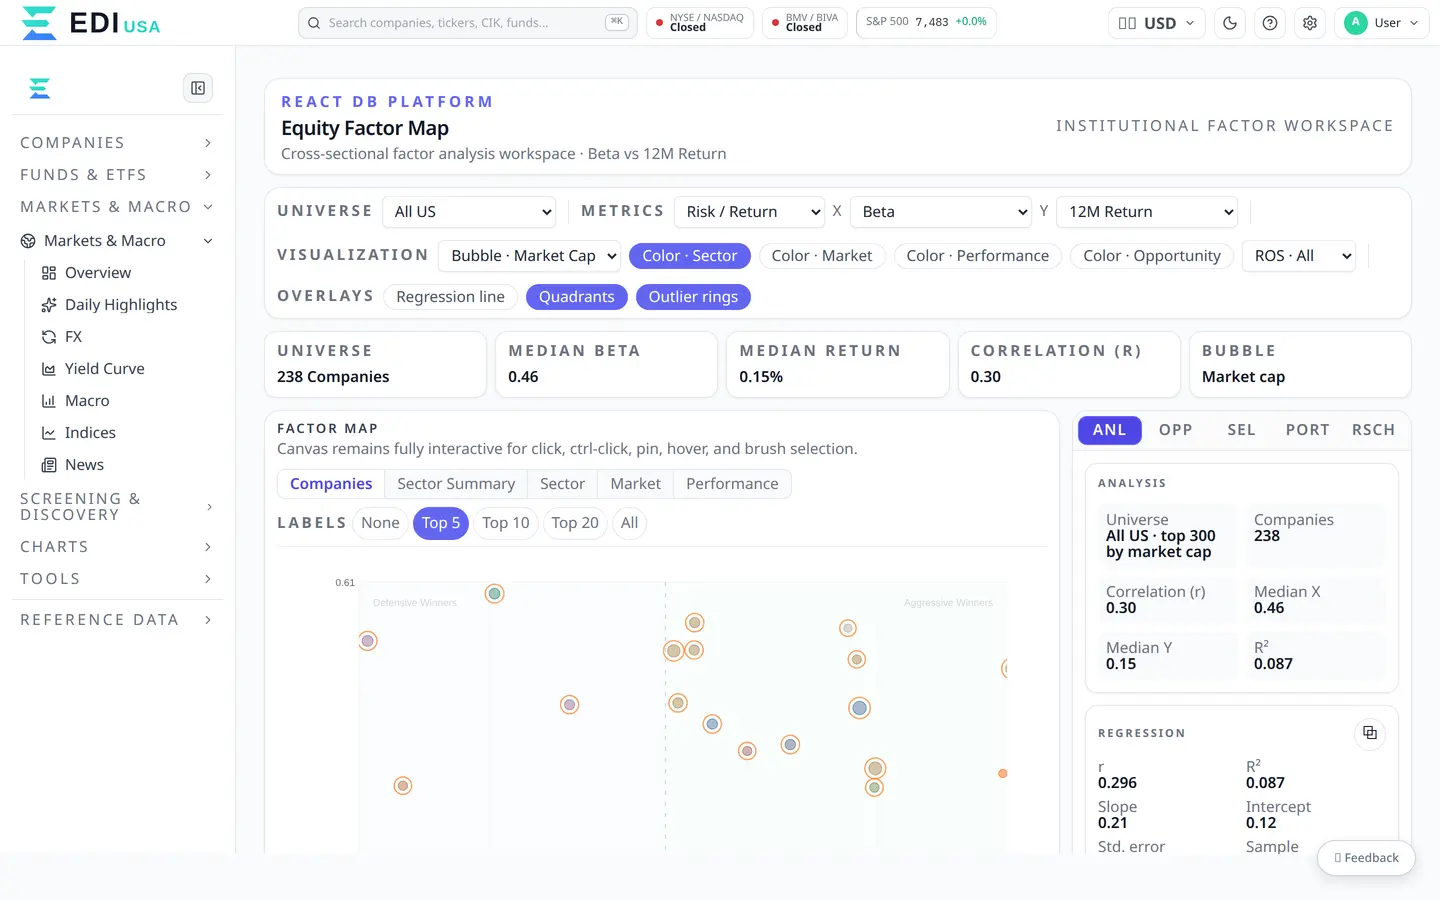
See how correlated assets move together through pair analysis, cointegration, and a normalized spread.
CointegrationZ-scoreBacktest on the spread
INDICATORS/07 OF 15
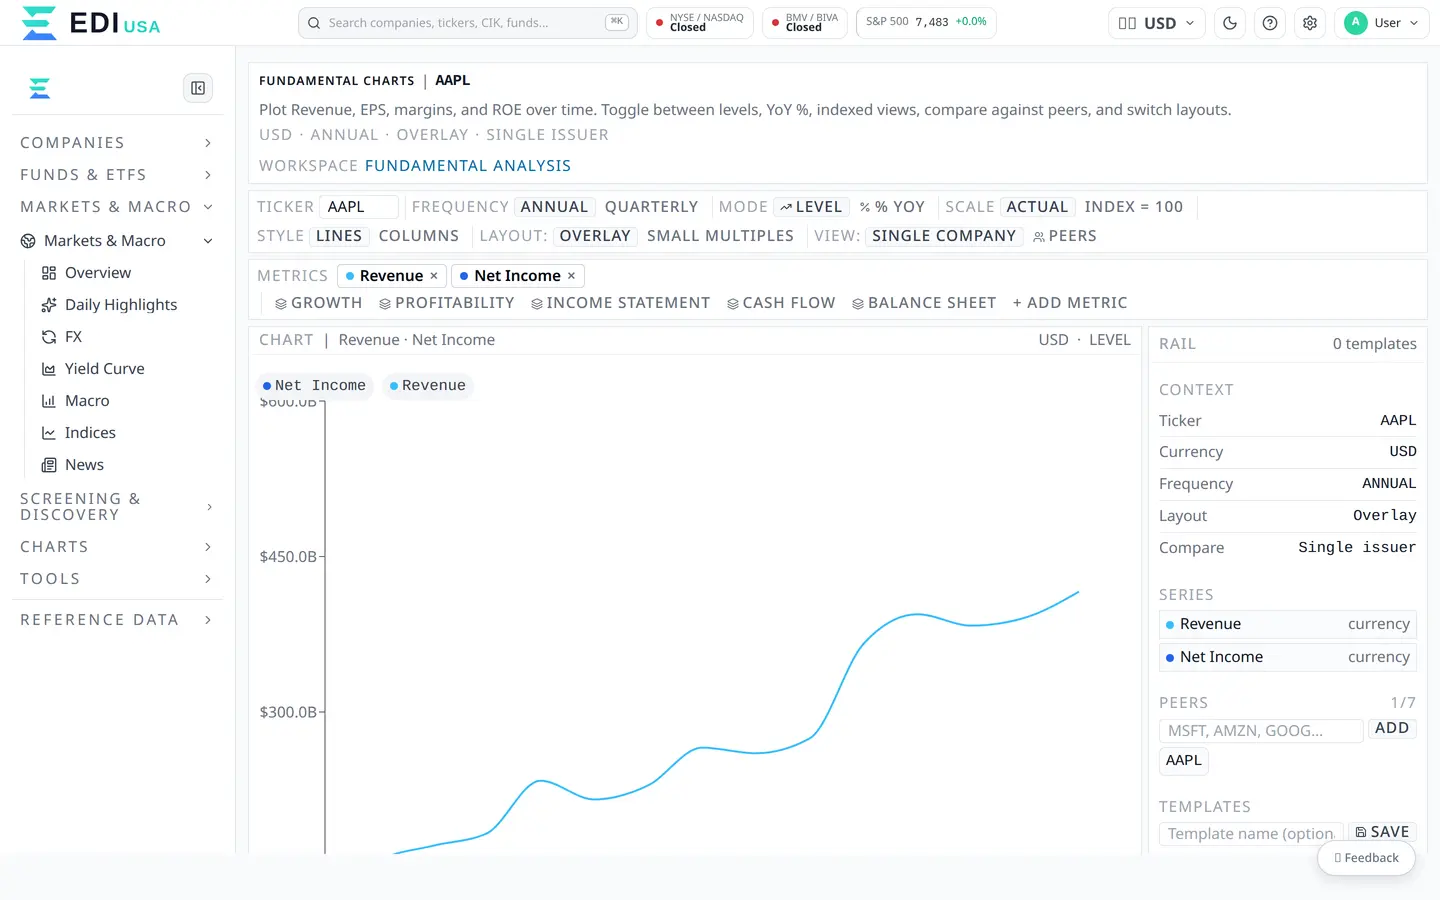
Financial Indicators
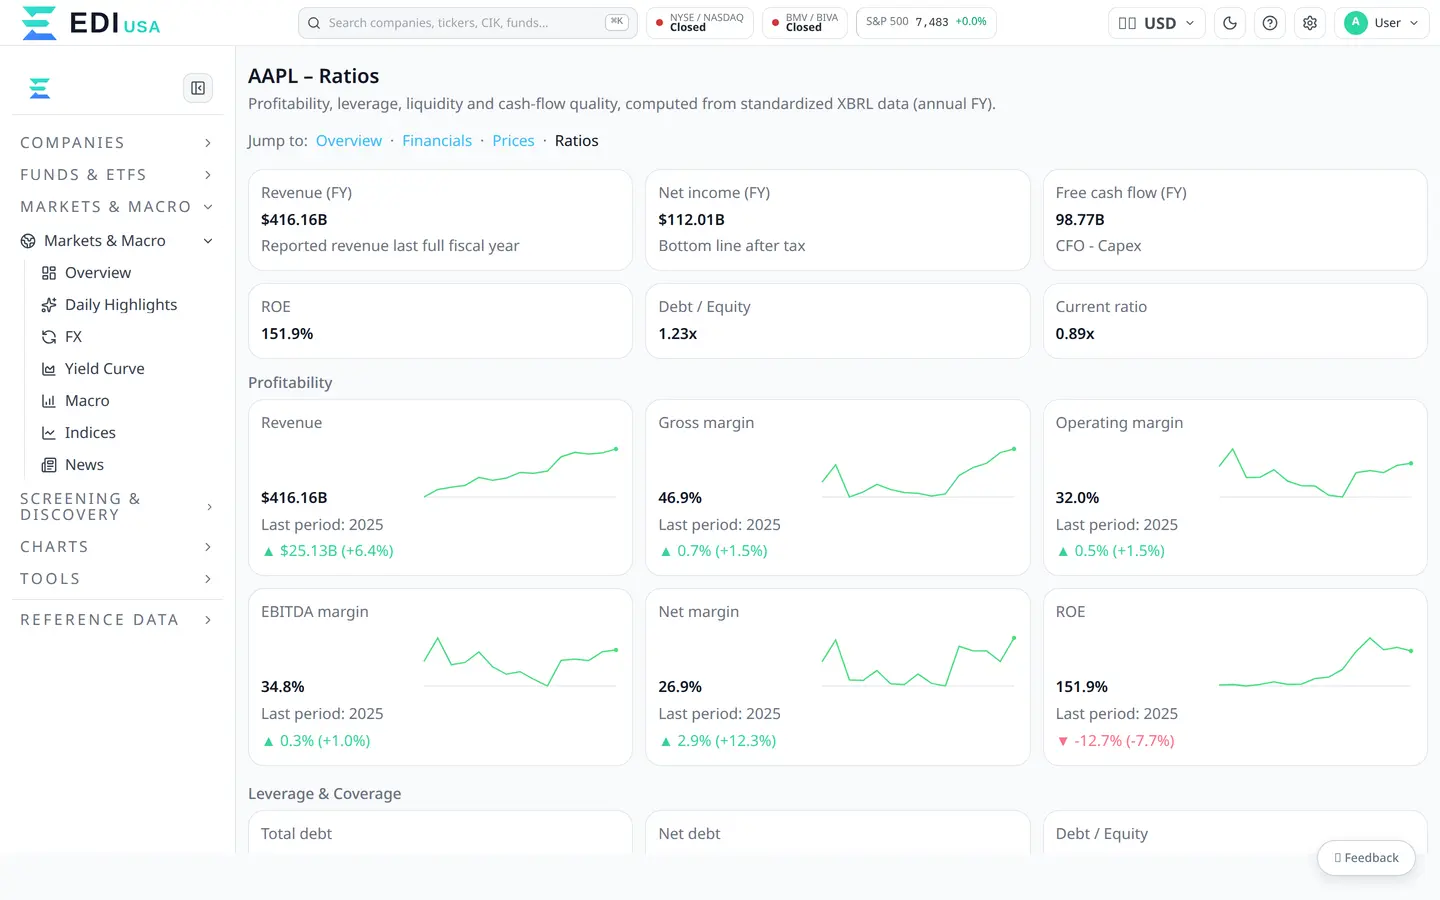
A broad library of financial indicators computed directly on the EDI Finance base — multiples, liquidity, leverage, profitability, growth, quality, and valuation— each one delivered as a consistent historical series.
MultiplesProfitabilityLiquidityGrowth
INDICATORS/08 OF 15
Technical Indicators
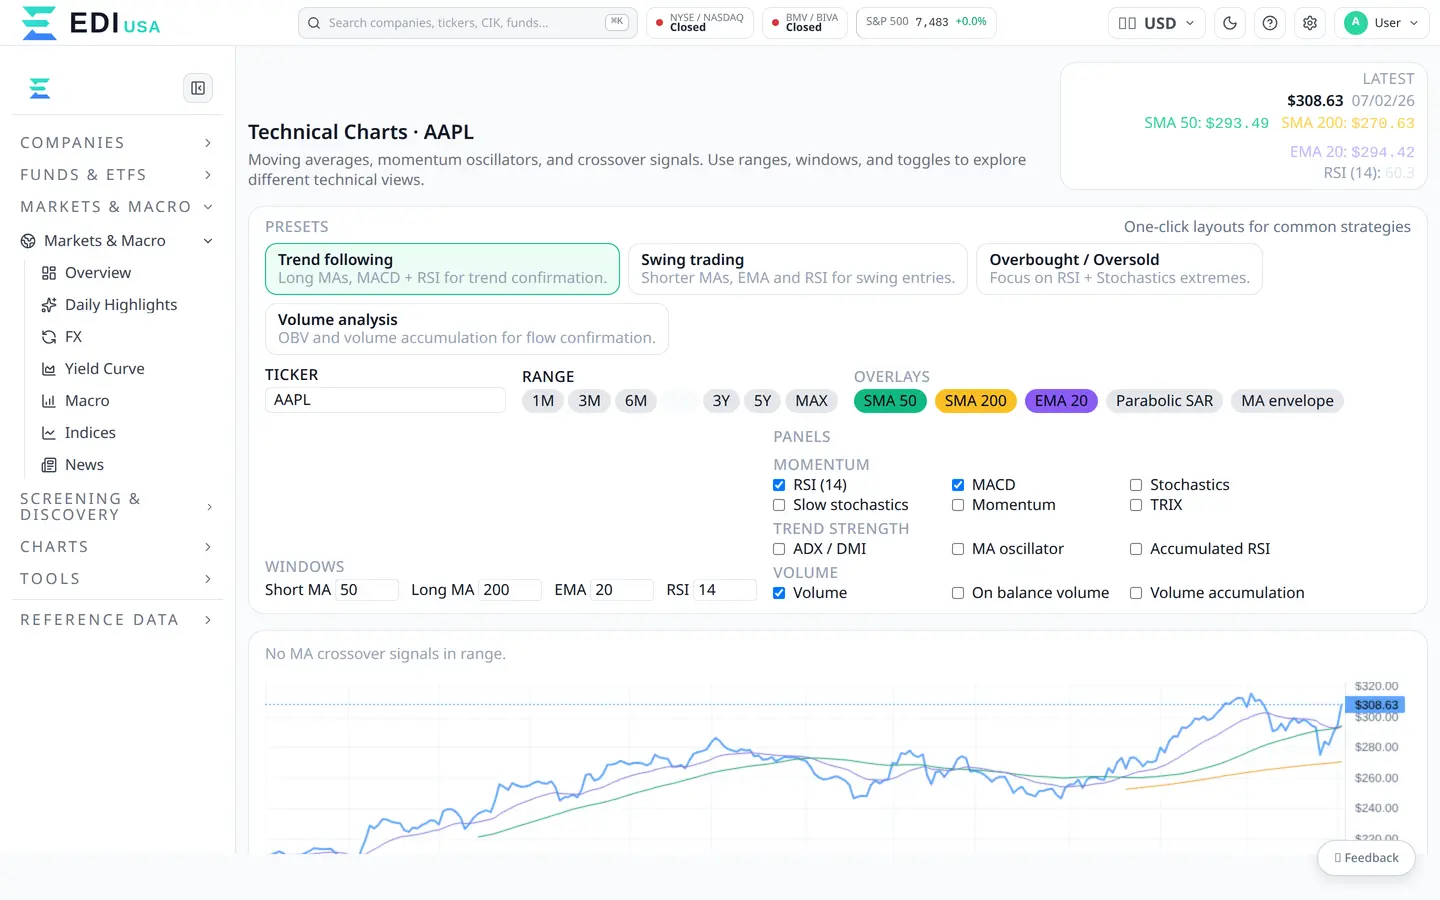
Apply a wide set of technical indicators to any asset in the base, tuning parameters and periods wherever each indicator allows.
Technical studiesMade to measureMulti-TF
INDICATORS/09 OF 15
Market Indicators
Market indicators such as P/L, P/VPA, EV/EBITDA, Market Value, and Enterprise Value, all derived from the full history of the EDI Finance base.
P/LMarket ValueEnterprise ValueEV/EBITDA
DATABASE/11 OF 15
Financial Statements
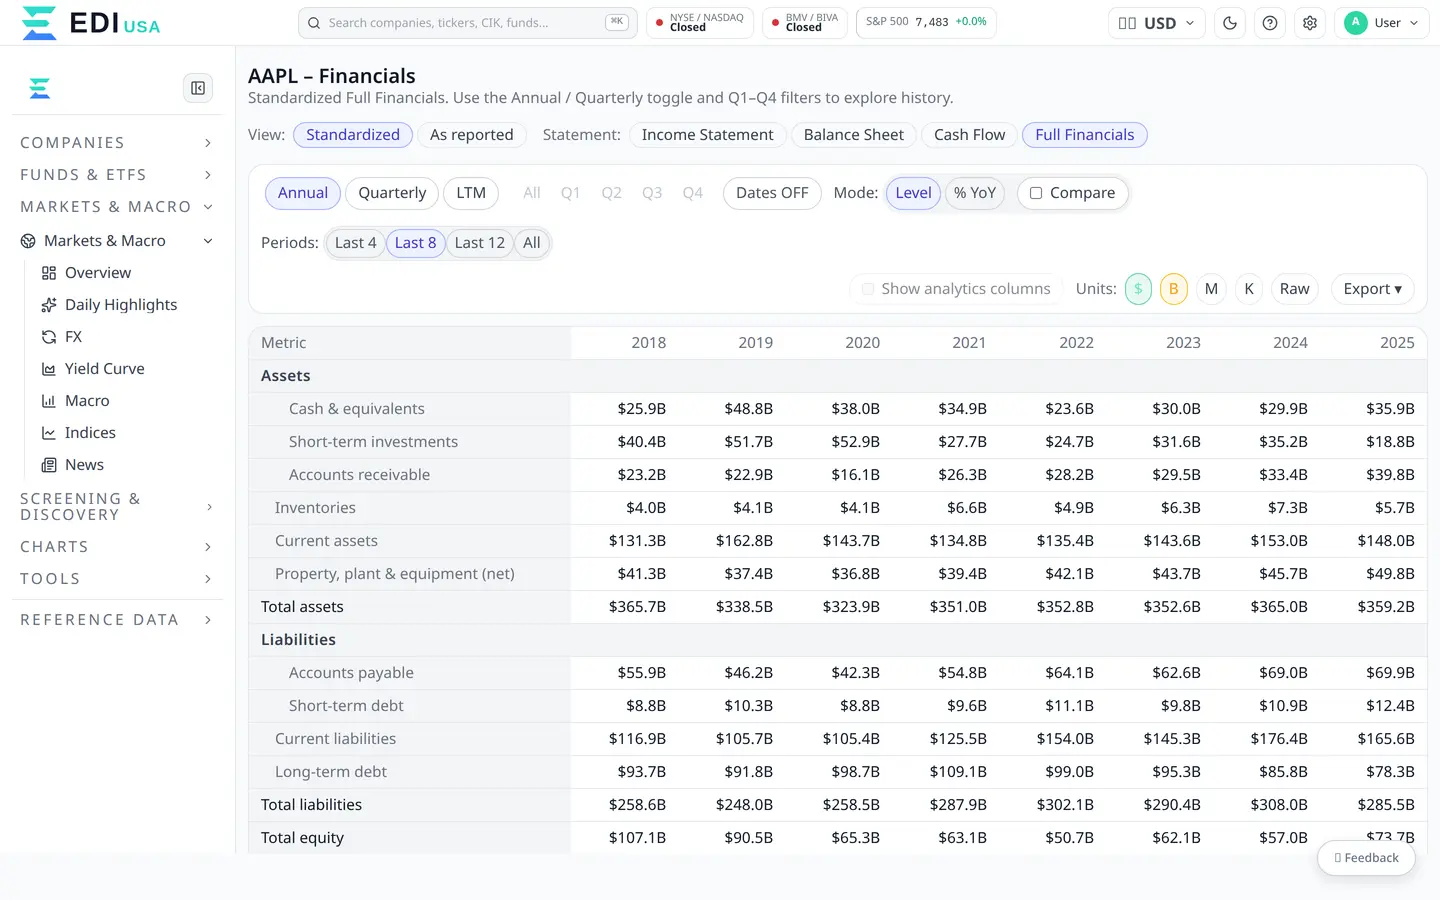
Balance sheets, income statements, cash flow statements, and other financial statements in IFRS and additional standards, with comparable series and consolidation adjustments reaching back to 1986.
IFRSFull historyConsolidatedQuarterly
DATABASE/12 OF 15
Quotes
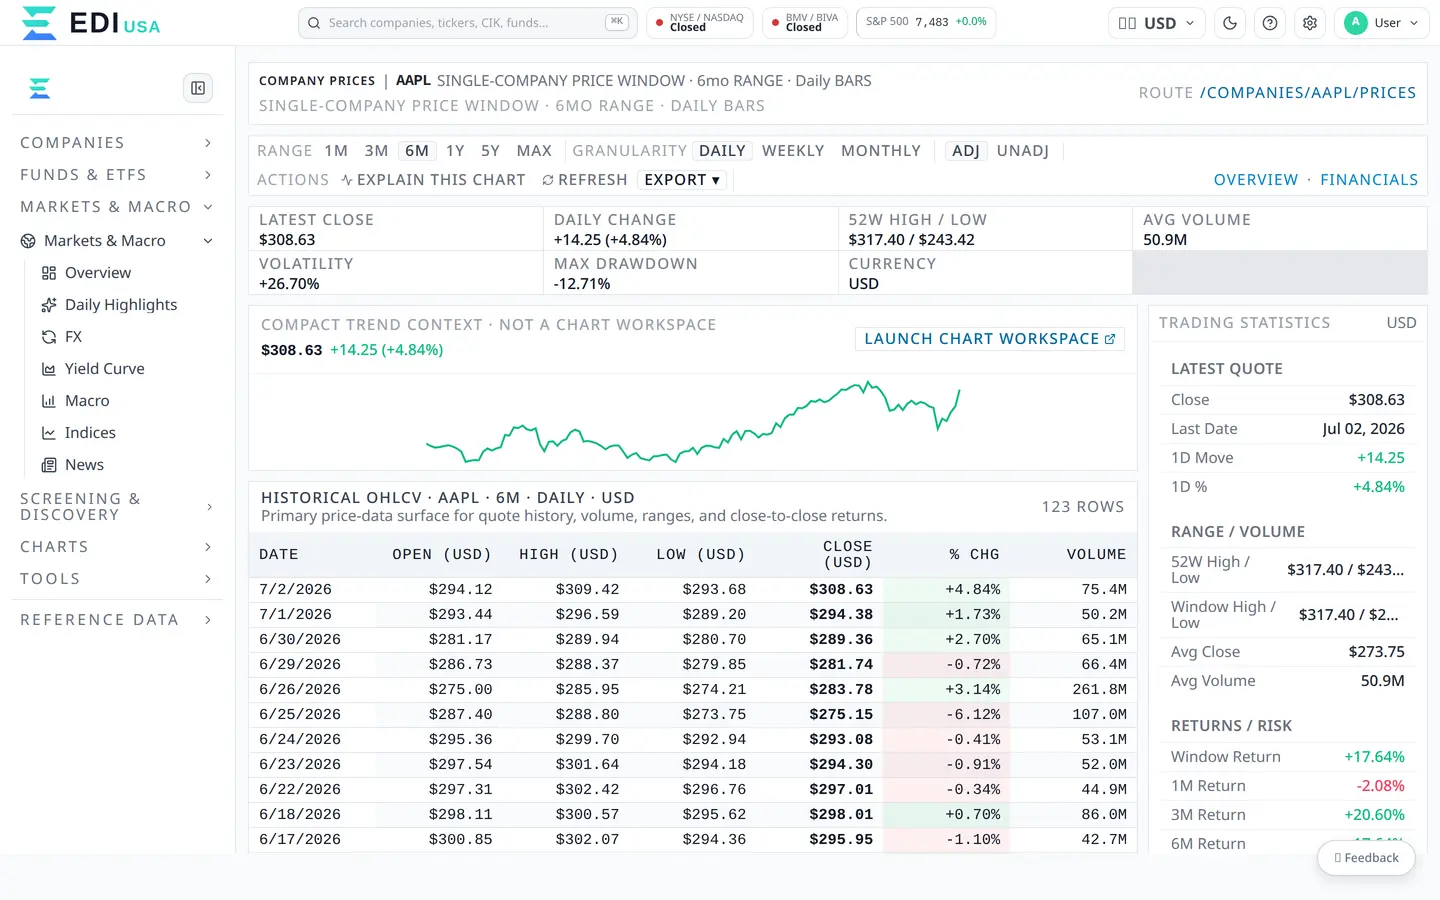
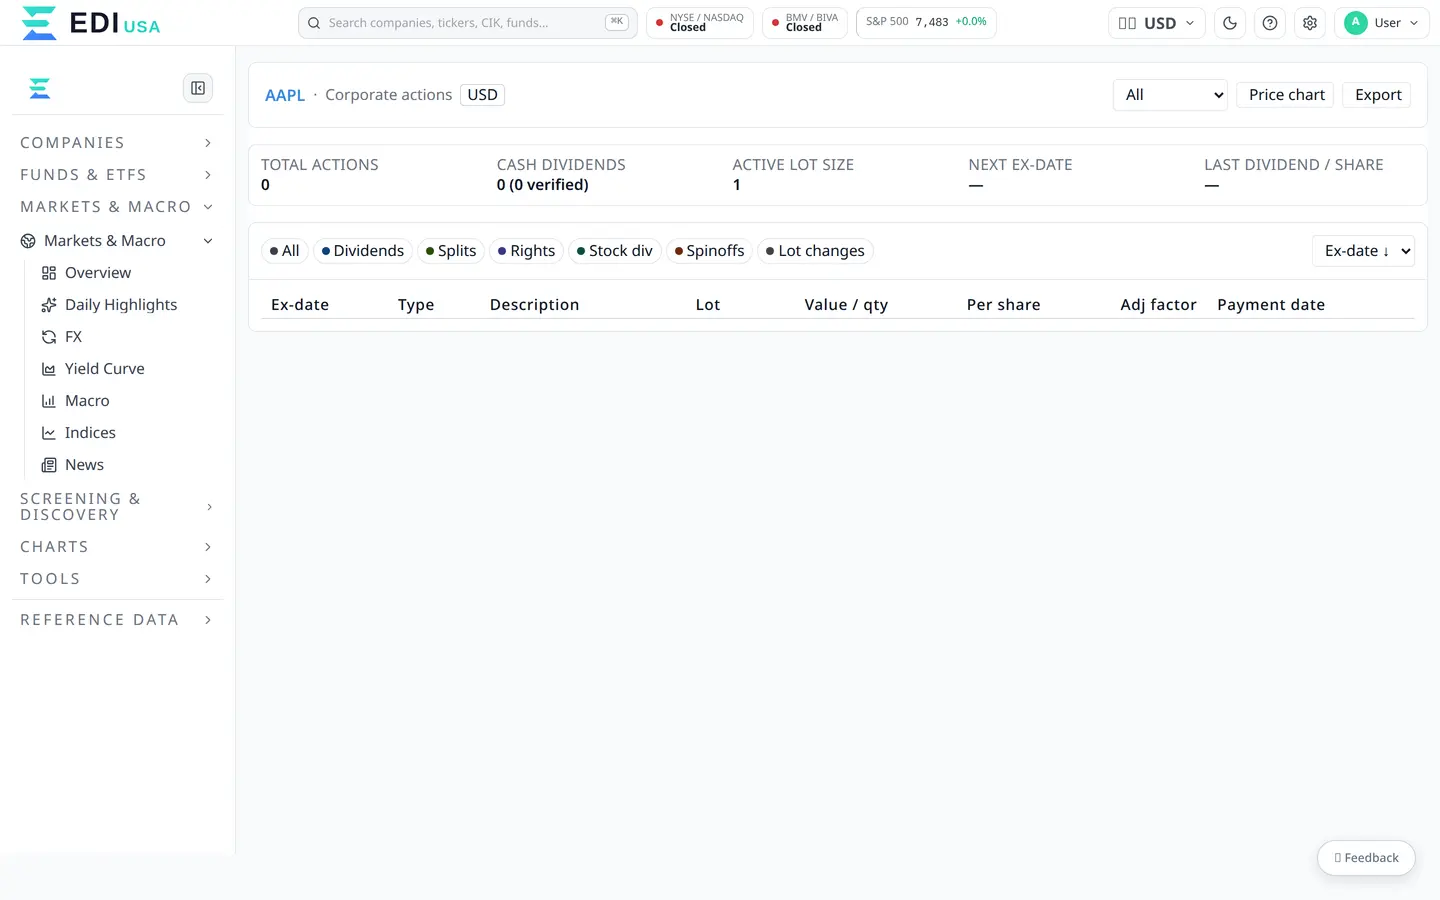
Historical price series already adjusted for dividends, splits, and bonuses, with international reach across stocks, funds, indices, currencies, and fixed income.
IntradayAdjustedGlobalMulti-asset
DATABASE/14 OF 15
Shareholders & Composition
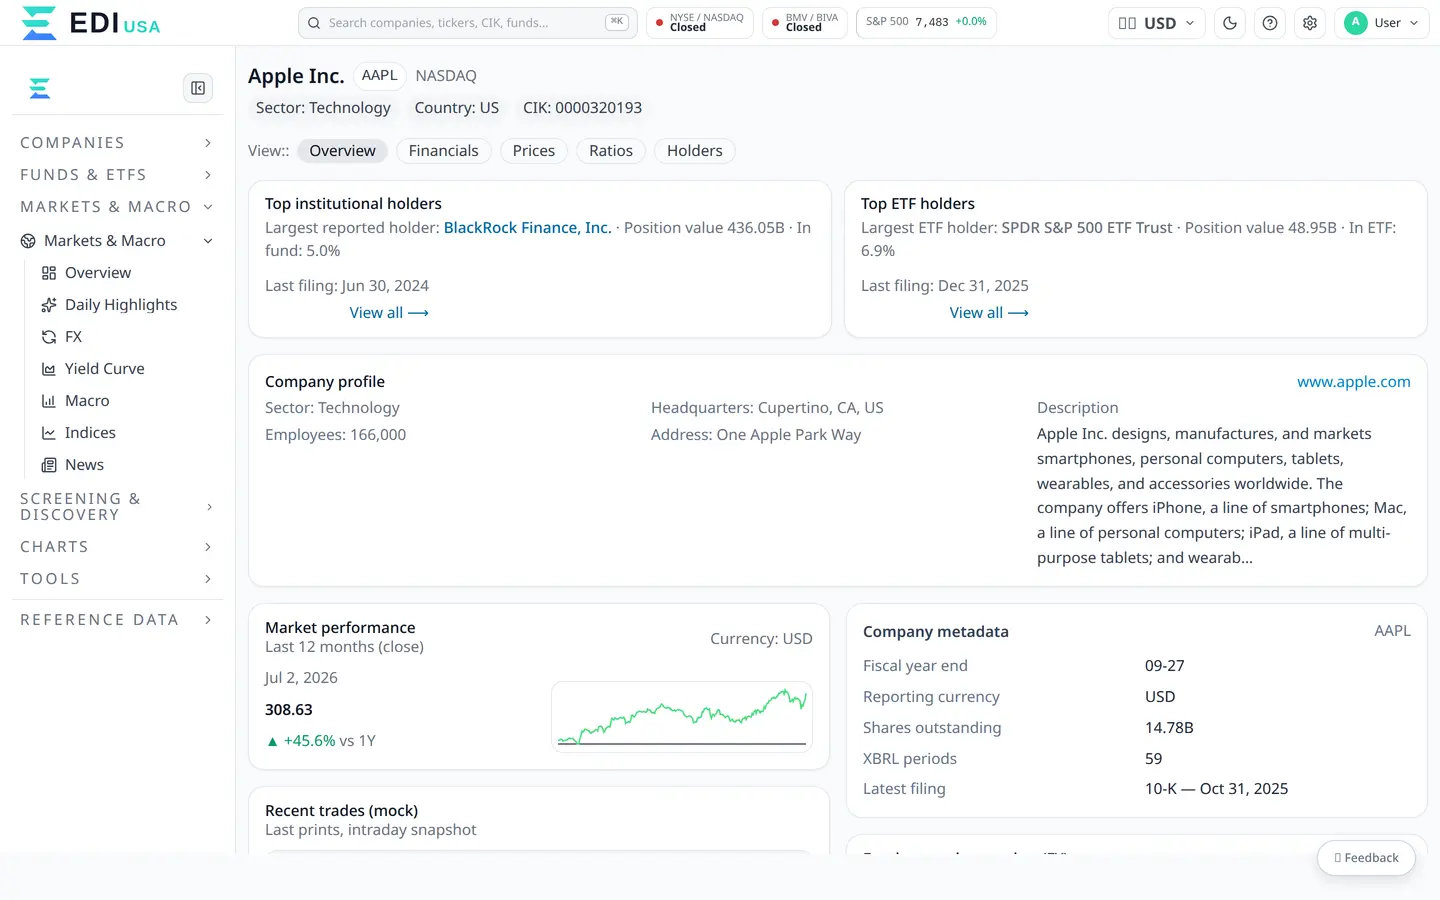
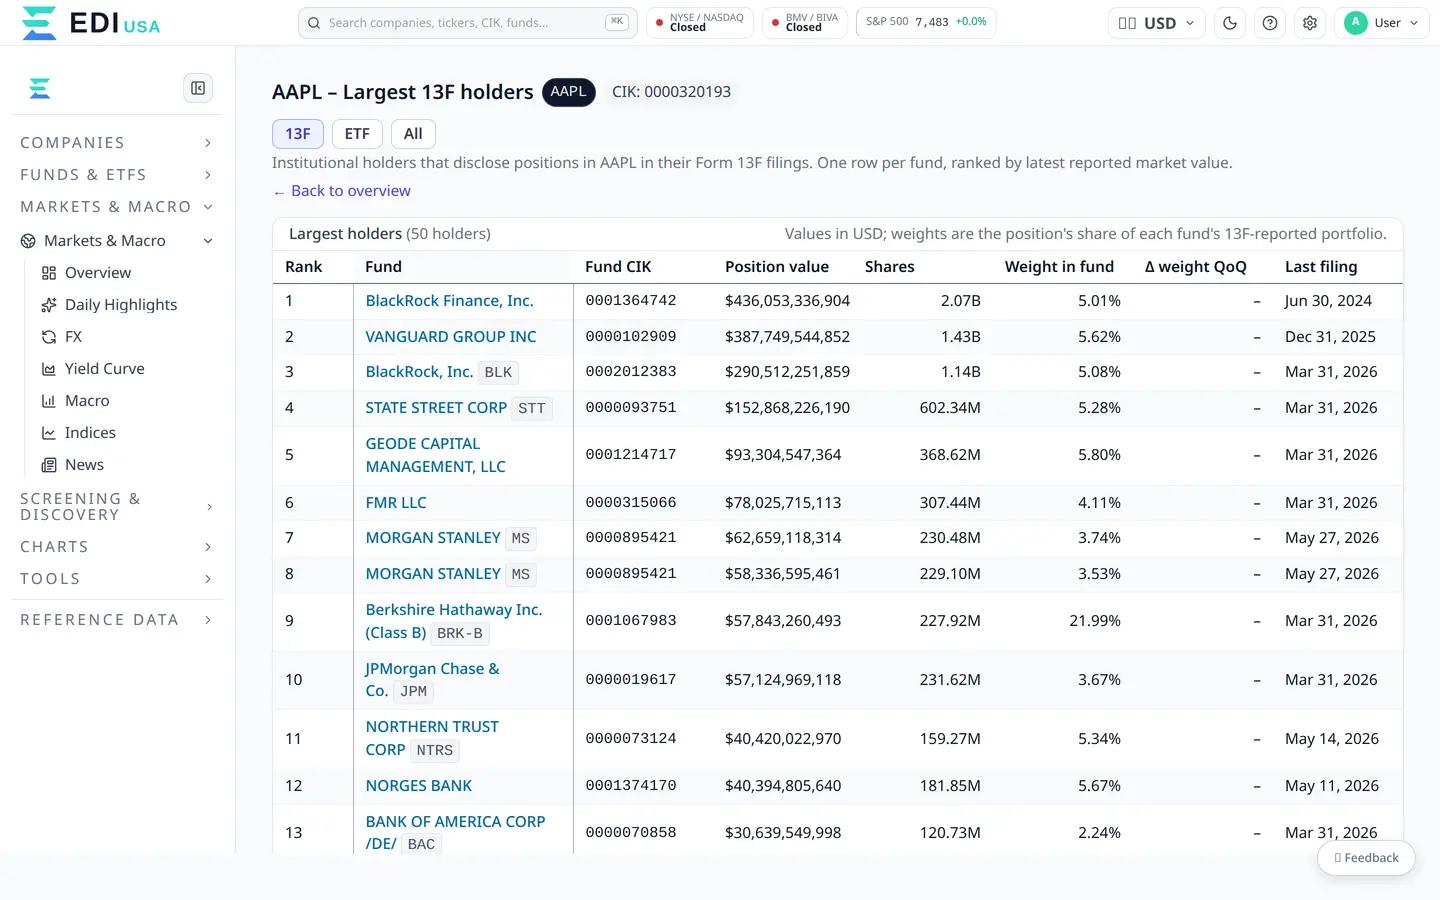
Who controls the company, how much is free float, and how the key portfolios and indices are composed.
Free floatTop holdersIndicesPortfolios
DATABASE/15 OF 15
News
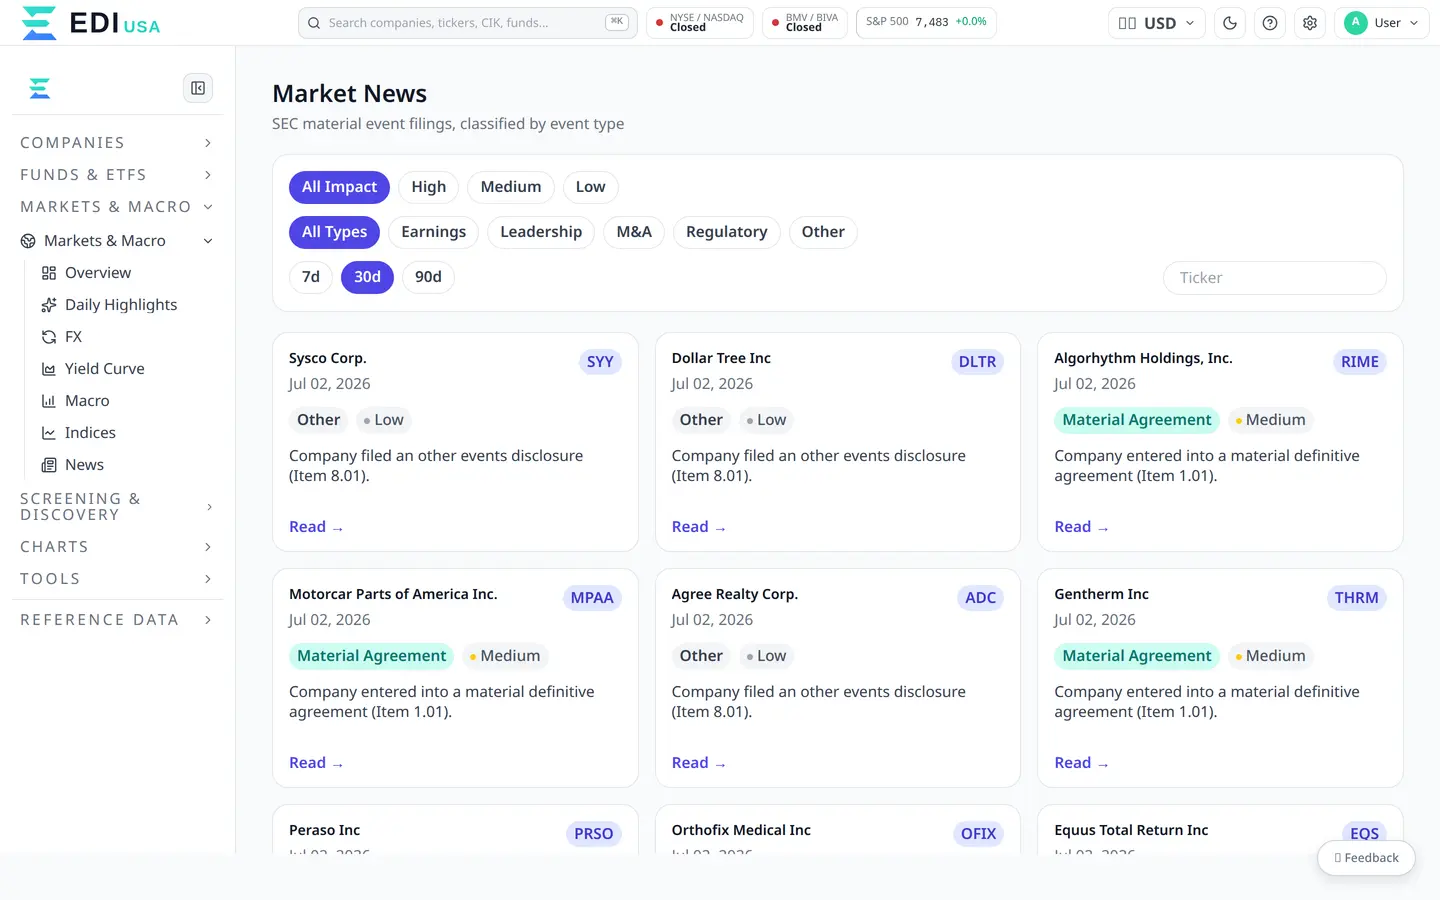
Relevant events and official company disclosures, ingested continuously.
Search the historyAsset by asset